Tutorial 5: Debugging Fortran code with Visual Studio Code (VSCode)
This takes a bit more initial configuration (that may be less than obvious) than some other languages, so we’ll walk you through this.
Tip
Click on the boxes throughout this tutorial labeled “More Detail (click here to show/hide)” in order to see more detailed information and/or helpful hints. Click again to hide the info again.
More Detail (click here to show/hide)
Tip
Click any picture to enlarge it. (Then use your browser’s ‘Back’ button to return to the tutorial).
You will learn to …
Configure VSCode for debugging Fortran code
Create tasks in VSCode
Perform basic debugging of Fortran code in VSCode
Prerequisites
The Modern Fortran extension for VSCode (This requires and will automatically install the C/C++ extension as well)
(As an alternative to the above, we have also successfully used the Fortran Breakpoint Support extension with the C/C++ extension)
subMIT already has both
gfortranandgdbalready installed natively, so you don’t need to worry about those. However, if you wish to use a custom version ofgfortranin a conda environment, make sure you installgdbin that conda environment as well, as these are both necessary (e.g.conda create --name gfort_dbg -c conda-forge gfortran gdb).
Configuring VSCode to debug Fortran
Follow the directions outlined directions to open a session connecting Visual Studio Code on your laptop (or desktop) to subMIT. (But do not open a folder yet once connected to subMIT).
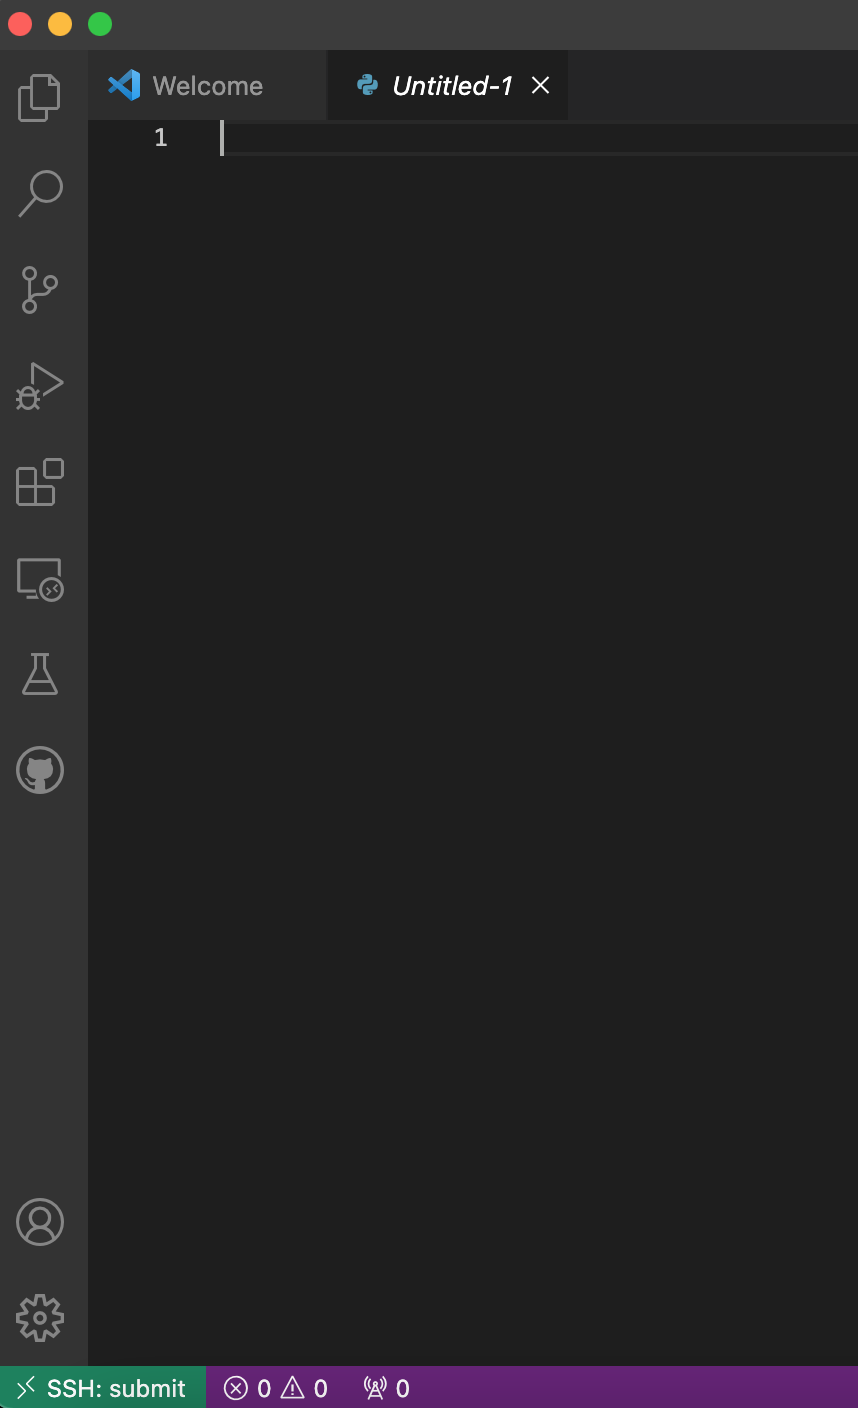
From the top menu, select “File” -> “New Text File …”
A new editor tab titled “Untitled-1” will appear (it may take a moment).
Copy & paste the following code into that editor window.
1program hello
2  integer :: i
3  i = 0
4  i = i + 1
5  i = i + 1
6  print *, 'Hello, World!'
7  print *, 'Hi again'
8end program hello
More Detail (click here to show/hide)
Click and drag in your browser to highlight the code above, then right-click and select “Copy”.
Click in the “Untitled-1” editor tab in VSCode. (You should see a vertical text cursor bar blinking next to the number “1”, indicating that the focus is set to line number 1).
From the menu, select “Edit” -> “Paste”. The code should now appear within your “Untitled-1” editor tab within VSCode.
From the menu, select “File” -> “Save”.
A drop-down menu will appear at the top of your screen suggesting a filename in your home directory on submit. It will look something like: /home/submit/username/program hello.md, where “username” is your subMIT (kerberos) username.
Change this to (without the quotes) “/home/submit/username/tutorial_vscode_dbgfort/hello.f90”, but replace “username” with your subMIT (kerberos) username. Then hit OK.
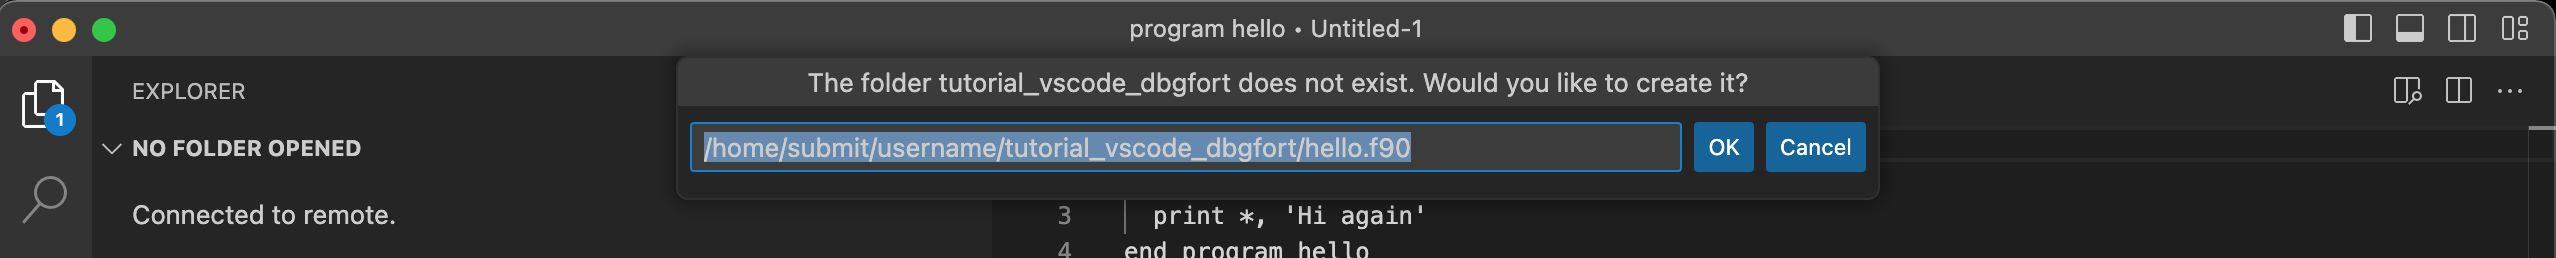
VSCode will now prompt you, “The folder tutorial_vscode_dbgfort does not exist. Would you like to create it?”. Hit the “OK” button.
More Detail (click here to show/hide)
This is because we included a directory that does not exist yet in the path we just entered, at the top of the screen.
This created a directory (folder) and a file in your subMIT home directory (on the subMIT servers).
In the menu (top of screen), select “File” -> “Open Folder…”
In the text box that appears at the top of your screen, type (without the quotes) “/home/submit/username/tutorial_vscode_dbgfort/” but replace “username” with your subMIT (kerberos) username. (It is likely already pre-filled).
Hit OK.
VSCode will re-establish your connection to subMIT and may take a moment.
Create a custom task (we will later use this as a preLaunchTask) by following these steps:
Select “File” -> “New Text File” from the menu.
Copy and paste the following into the editor for this new blank file:
{
    "version": "2.0.0",
    "tasks": [
        {
            "type": "shell",
            "label": "gfbuild",
            "command": "gfortran hello.f90 -g3 -O0 -fbacktrace -fcheck=all -ffpe-trap=zero,overflow,underflow -Wall -Wextra -Warray-temporaries -Wconversion -ffree-line-length-0",
        }
    ]
}
More Detail (click here to show/hide)
The above is only a recommended set of flags to pass to
gfortran; please consult the gfortran manual to check what settings are appropriate for your project. To open the manual, runman gfortranon subMIT (this can even be done from the Terminal inside VSCode).It is usually also desirable to add
-fimplicit-none -finit-real=nanto thegfortranline in the “command” entry above.Select “File” -> “Save” from the menu.
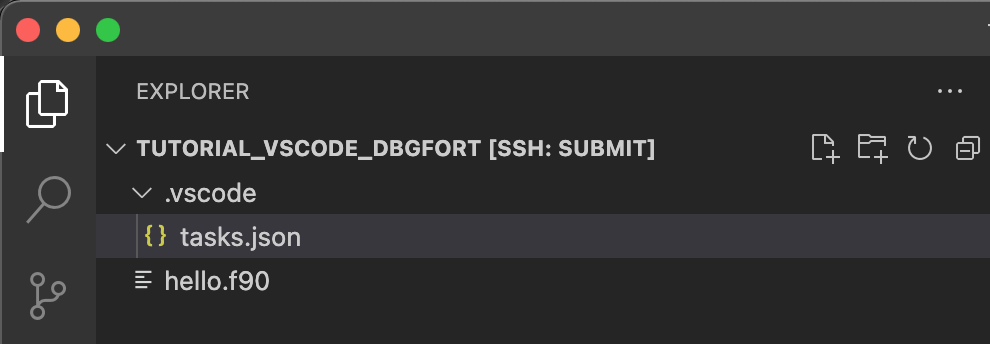
In the box that appears at the top of the screen, enter (without the quotes) “/home/submit/username/tutorial_vscode_dbgfort/.vscode/tasks.json”, but replace “username” with your subMIT (kerberos) username. Then hit OK. (Also hit OK when it asks if you want to create the folder “.vscode”).
You should now see tasks.json appear in the Explorer sidebar (“View”->”Explorer” from the top menu, or click on the sidebar icon)
More Detail (click here to show/hide)
Alternatively, you could use the command palette:
Open the command palette .. todo: add in how for all OS
Type “tasks: Configure Task” in the text box that appears at the top of your screen. Then hit Enter/Return.
Select “Create tasks.json file from template” from the drop-down menu that appears at the top of your screen.
Select “Others” from the drop-down menu that appears.
This will bring up an editor with a json file pre-filled.
Replace the contents of that editor with the lines in the code block above
More Detail (click here to show/hide)
Delete all the lines that were pre-filled in the editor, then copy the above lines and paste them into the editor. Then click “File” -> “Save” from the menu.
Click “File” -> “Save” from the menu
Create a launch configuration by performing the following steps:
“File” -> “New Text File” from the top menu
Copy & Paste the following into the edtior for this new blank file:
{
    "version": "0.2.0",
    "configurations": [
      {
        "name": "Debug Fortran (gdb)",
        "type": "cppdbg",
        "request": "launch",
        "preLaunchTask": "gfbuild",
        "program": "${workspaceFolder}/a.out",
        "cwd":     "${workspaceFolder}",
        "args": [],
        "environment": [],
        "stopAtEntry": false,
        "externalConsole": false,
        "MIMode": "gdb",
        "setupCommands": [
          {
            "description": "Enable pretty-printing for gdb",
            "text": "-enable-pretty-printing",
            "ignoreFailures": true
          }
        ]
      }
    ]
}
Source: The above code is a slight variation of that provided by the Modern Fortran VSCode extension documentation.
More Detail (click here to show/hide)
Setting the “preLaunchTask” this way ensures that the “gfbuild” task we made earlier in tasks.json will be run every time before debugging.
We do this so that our code is compiled with the proper flags to actually enable debugging.
(Without this, our code would still execute when we select “Start Debugging”, but breakpoints and other debugging features would not work).
Select “File” -> “Save” from the top menu.
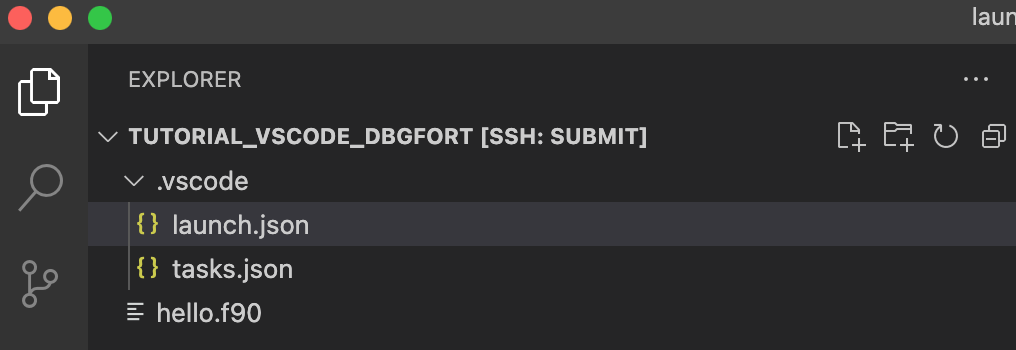
In the box that appears at the top of the screen, enter (without the quotes) “/home/submit/username/tutorial_vscode_dbgfort/.vscode/launch.json”, but replace “username” with your subMIT (kerberos) username. Then hit OK.
You should now see launch.json appear in the Explorer sidebar (“View”->”Explorer” from the top menu, or click on the sidebar icon)
More Detail (click here to show/hide)
Here we are leaving the executable as the default “a.out”. If you set things up to compile to a different filename, make sure to change the “program” attribute above.
If your program takes command-line arguments, you would place those in “args” attribute (currently empty in our example).
If you need to set environment variables, you would modify the “environment” attribute (currently empty in our example).
Hint
As suggested in the VSCode documentation, it’s handy to use IntelliSense to learn available attributes, or hover over an attribute for a description.
More information can be found vscode.
Go back to the hello.f90 editor (“View”->”Explorer” in top menu, then click on “hello.f90”) and create a breakpoint by doing the following:
Left-Click to the left of line 4. This should create a red dot to the left of line 4. (This red dot should persist after you move your cursor away).
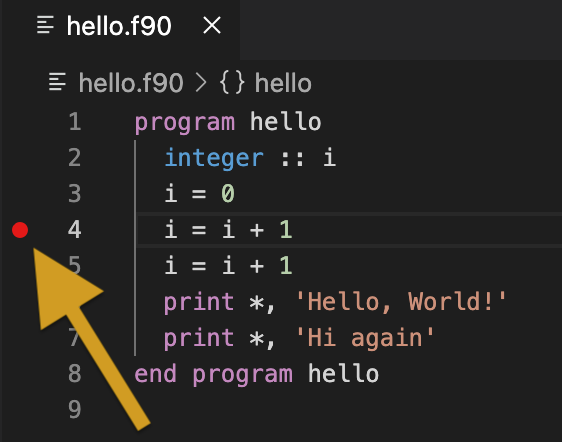
More Detail (click here to show/hide)
Alternatively, you could place your cursor on line 4 and, from the top menu, select “Run” -> “Toggle Breakpoint”
Select “Run” -> “Start Debugging” from the top menu to actually start debugging.
Your screen should then look like the screen shot below.
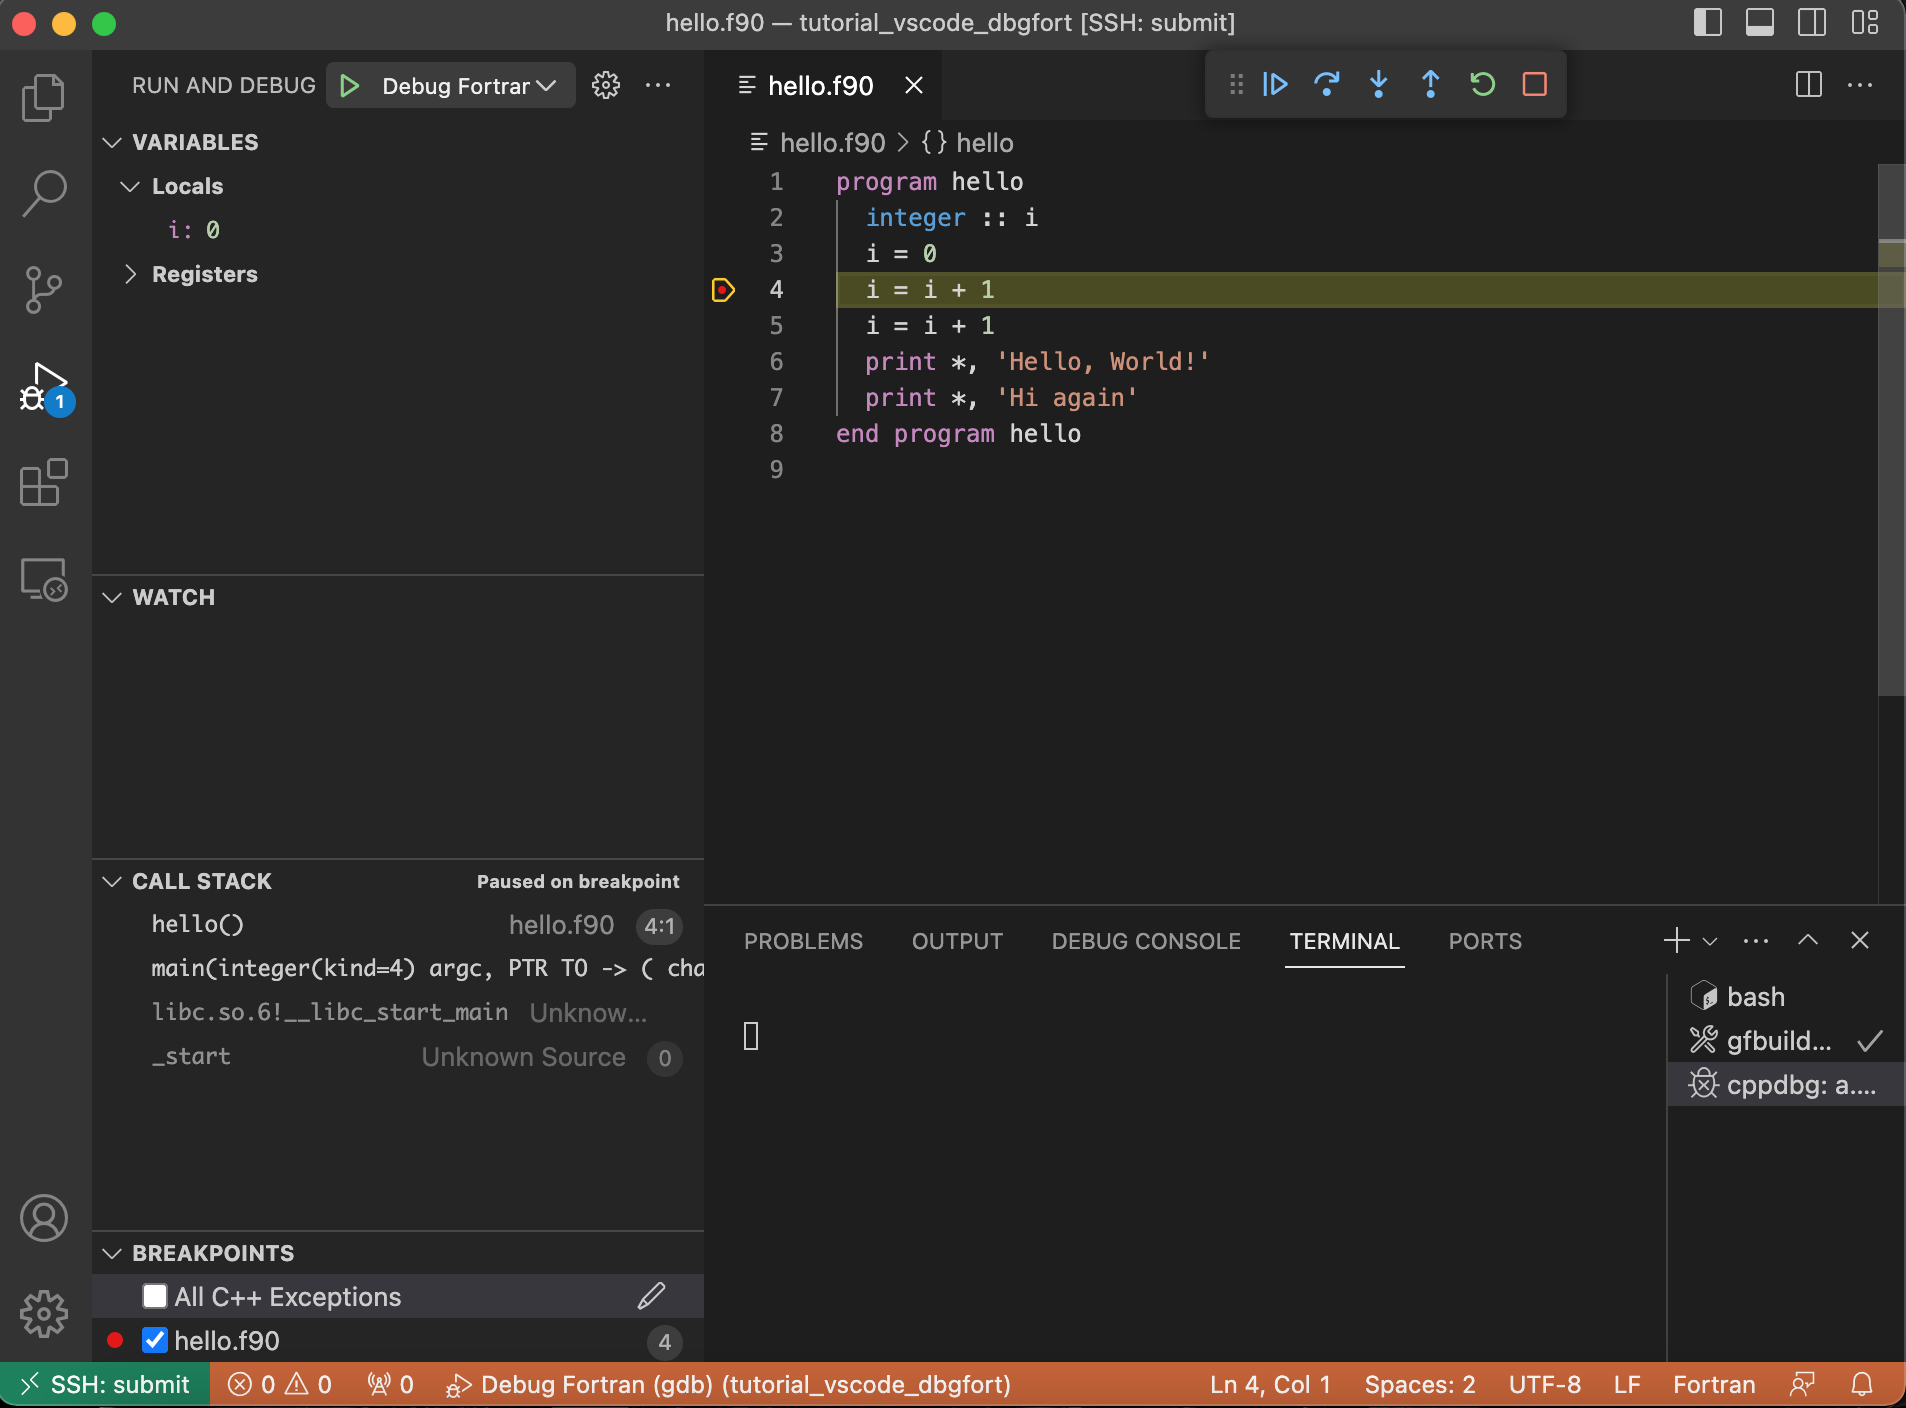
The Debug sidebar will open on the left and a terminal on the bottom of the screen.
Note that the yellow arrow to the left of line 4 (and highlighting) indicate that the execution is pause on line 4 (due to the breakpoint we set above).
In the upper left “Variables” section we can see that, at this point in execution, the variable
ihas the value0. (Hovering the mouse over any instance of the variableireveals the same).In the bottom left, we can navigate the call stack (this is helpful when code makes heavy use of functions).
The screen output of the program (e.g.
printstatements) will be displayed in the Terminal at the bottom.The debug navigation bar at the top of the screen (or the “Run” top menu) can be used to control the debug execution (e.g. Step Over/Into/Out, Continue, Stop).
You are now all set to debug your Fortran application on subMIT!
(To see an example of stepping through this program, click the “More Detail” below).
More Detail (click here to show/hide)
To advance to the next line of the code, click the “Step Over” button at the top of the screen (or select “Run”->”Step Over” from the top menu).
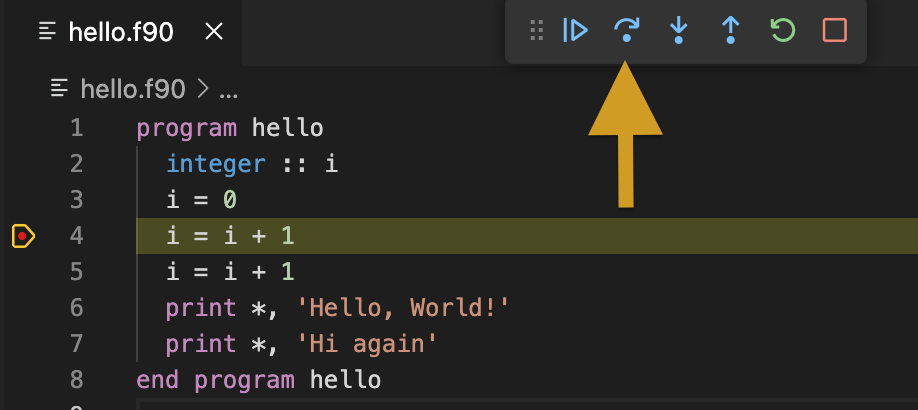
You will then see the following screen:
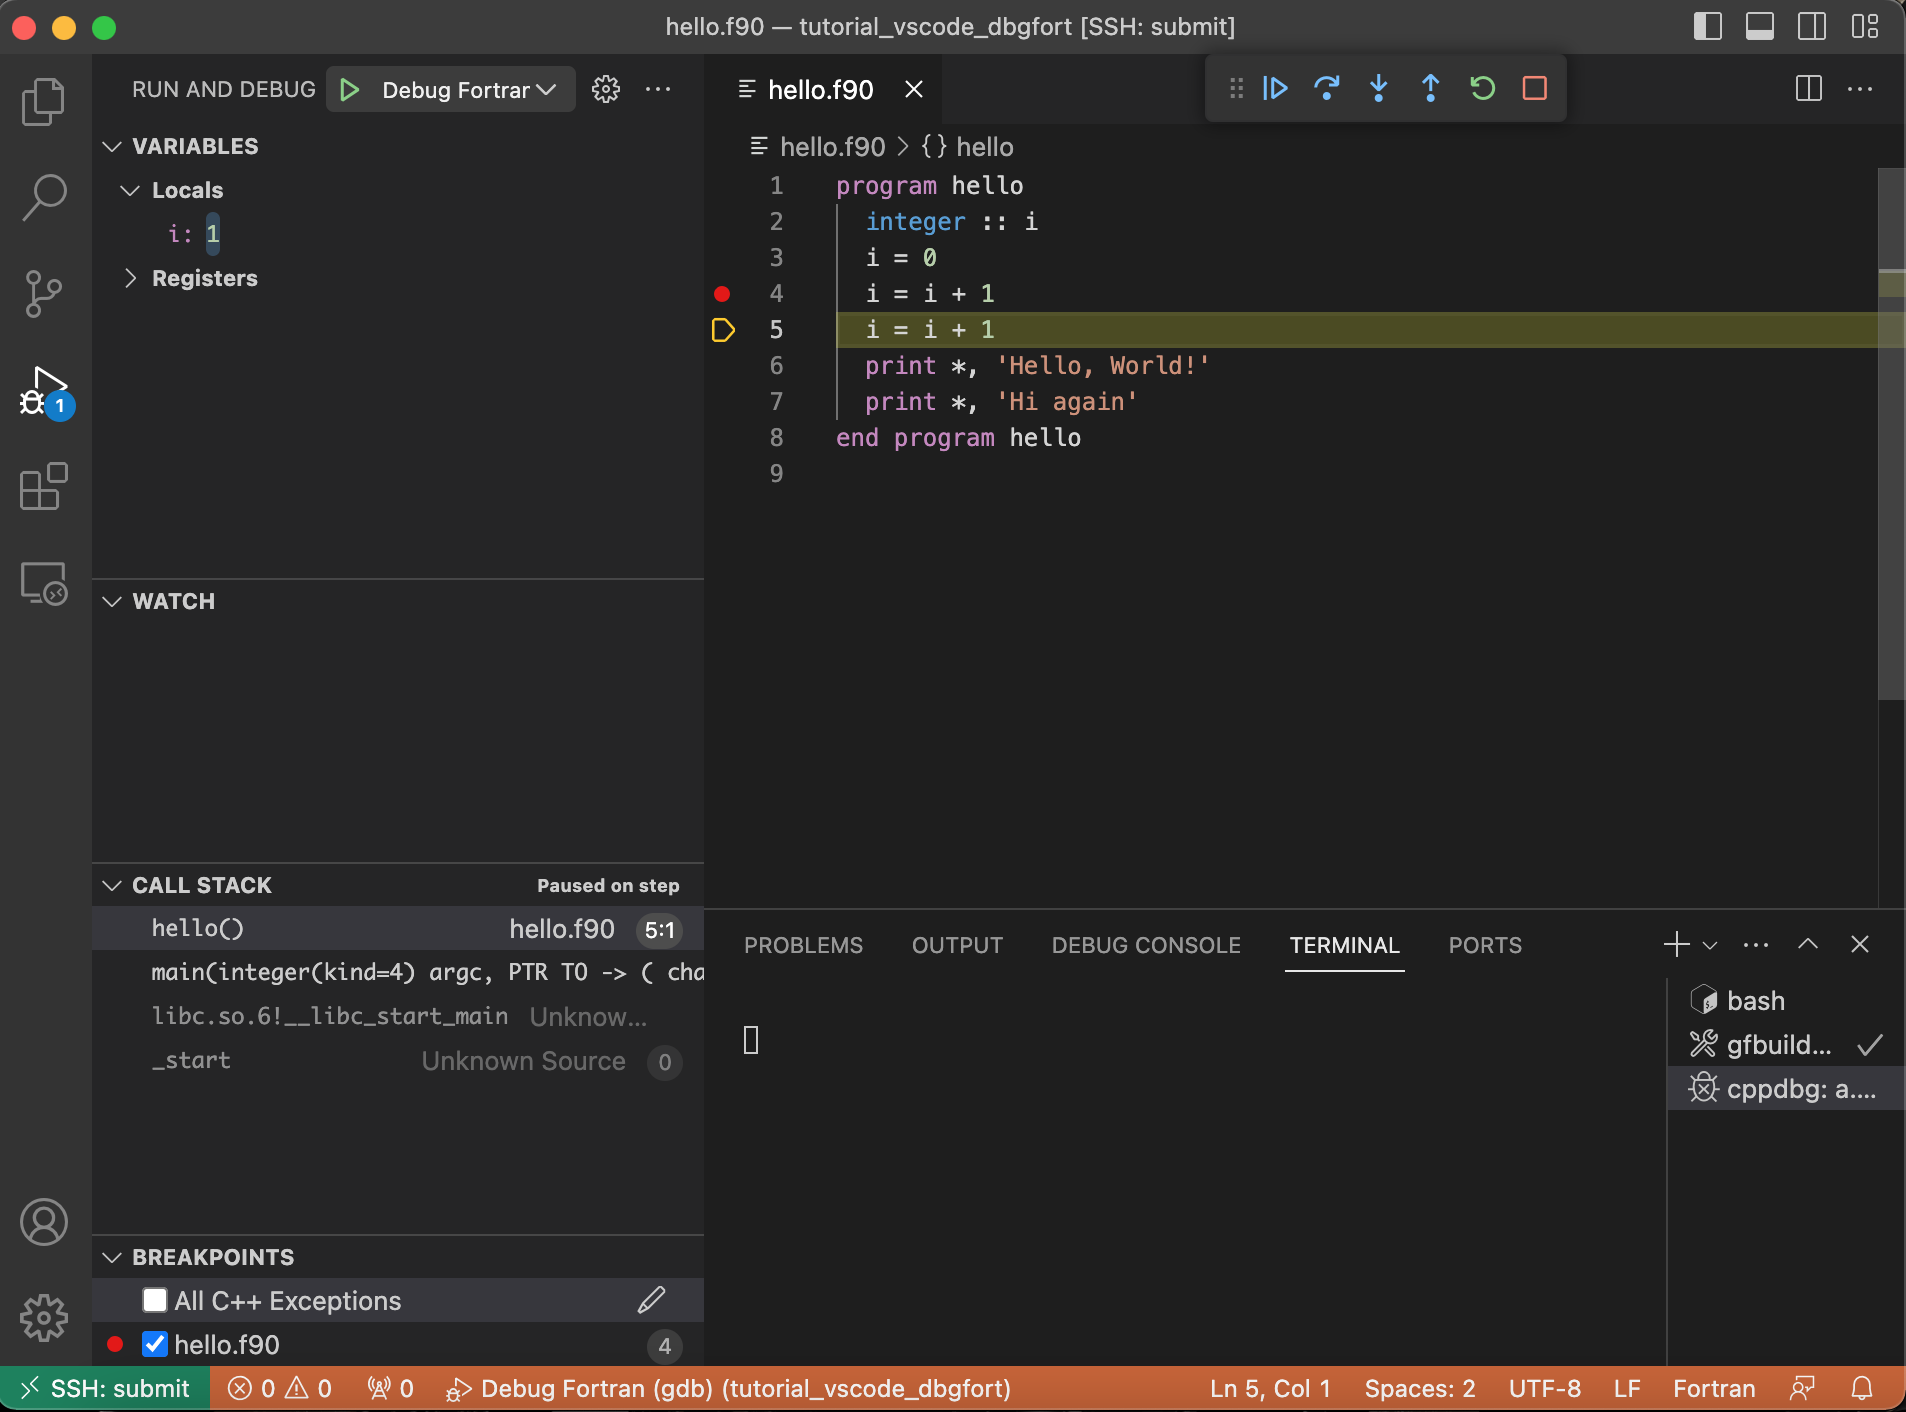
Note that now the yellow arrow and highlighting indicate that the execution is now halted on line 5.
Also note that, now that line 4 has been executed, the variable
inow has the value of1Click the “Step Over” button again to advance execution by one line.
You will then see the following screen:
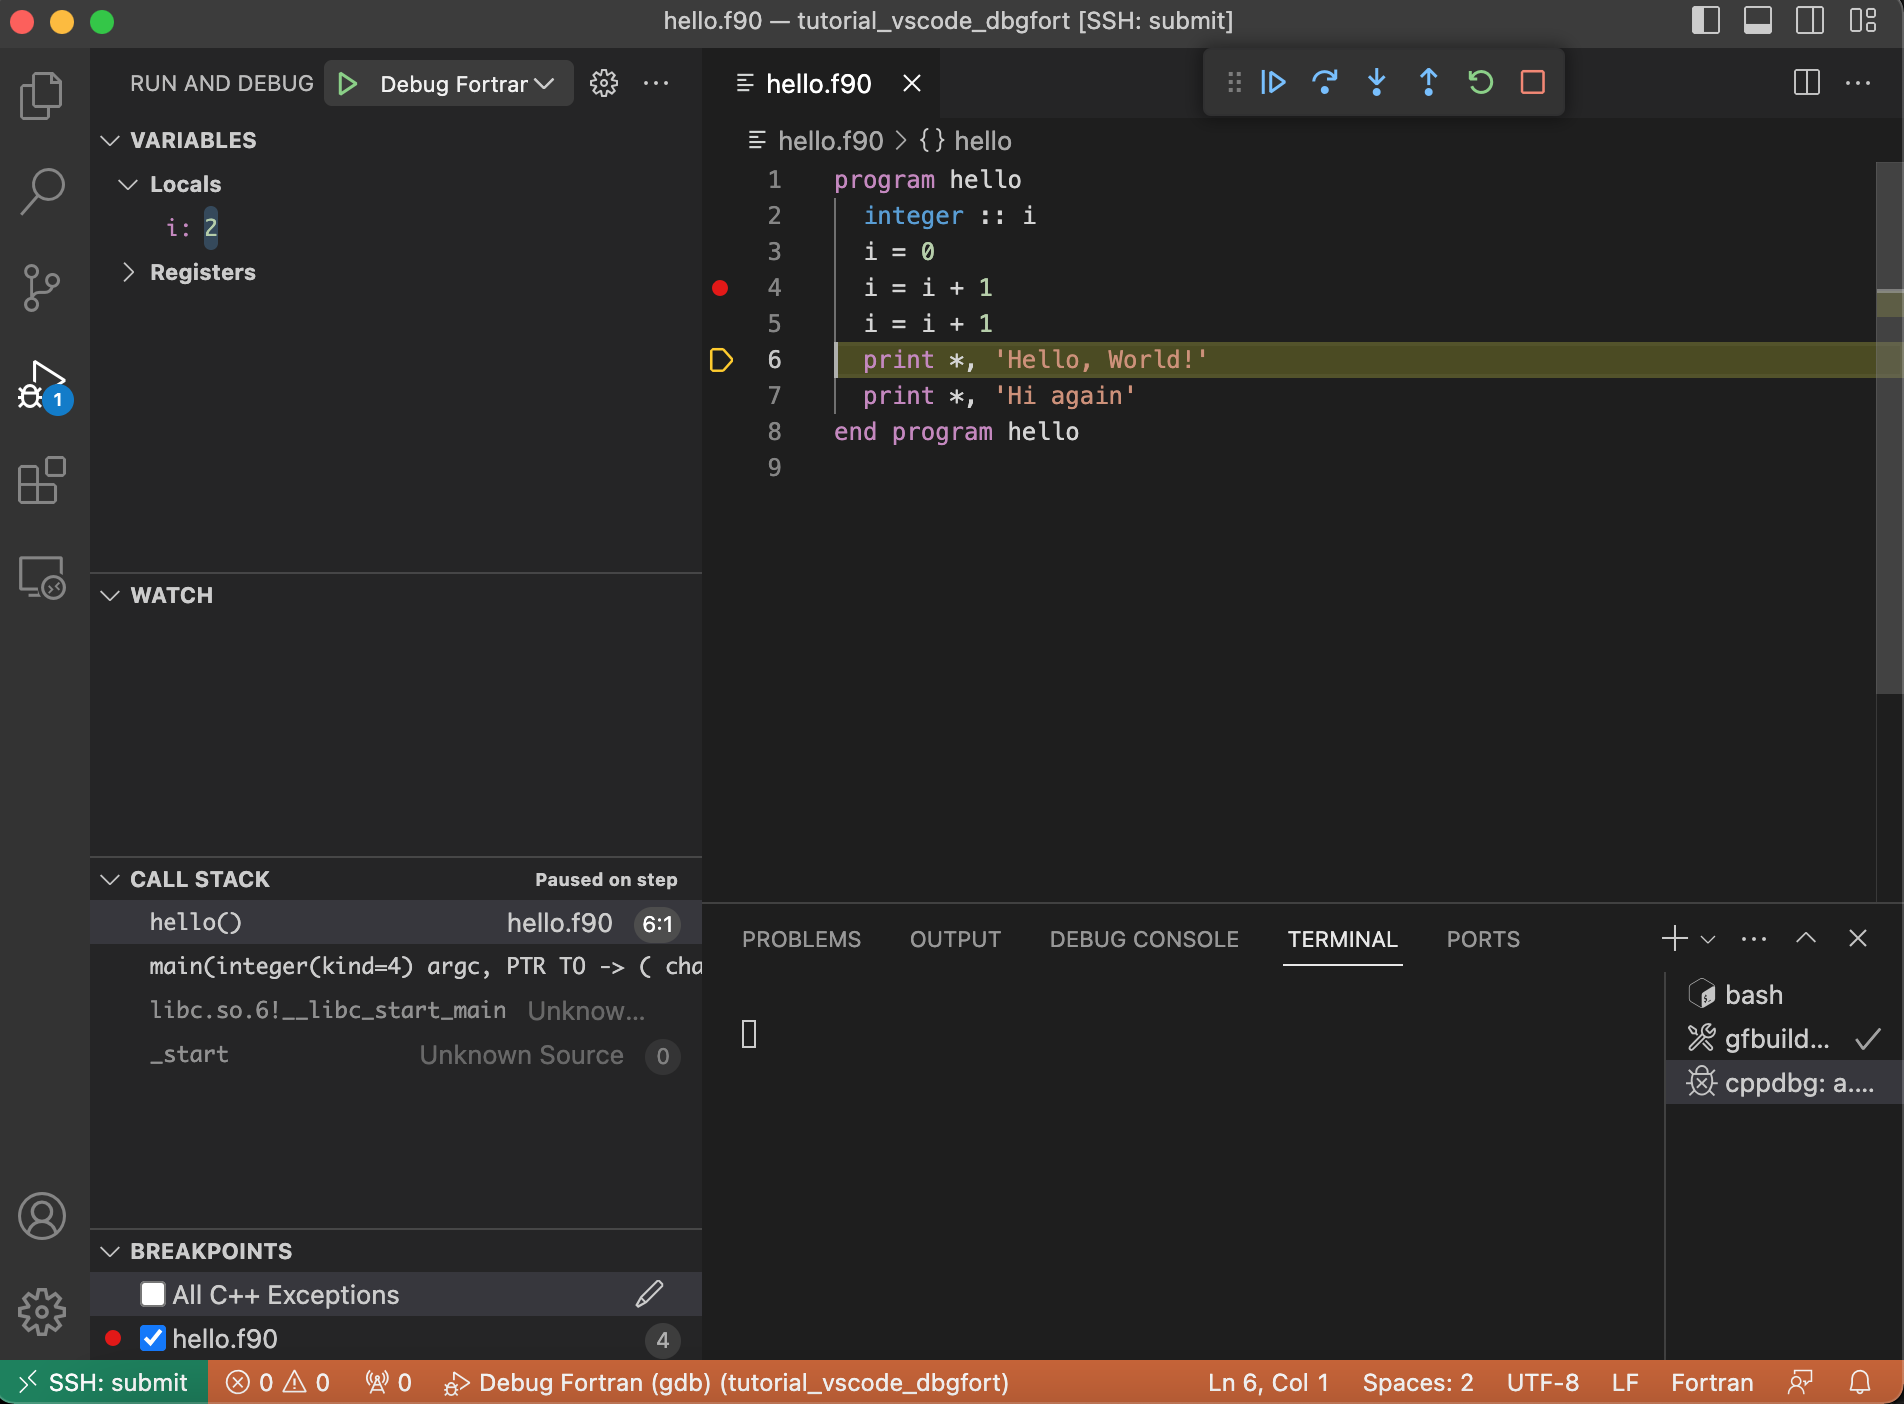
Note that now the yellow arrow and highlighting indicate that the execution is now halted on line 6.
Also note that, now that line 5 has been executed, the variable
inow has the value of2Click the “Step Over” button again to advance execution by one line.
You will then see the following screen:
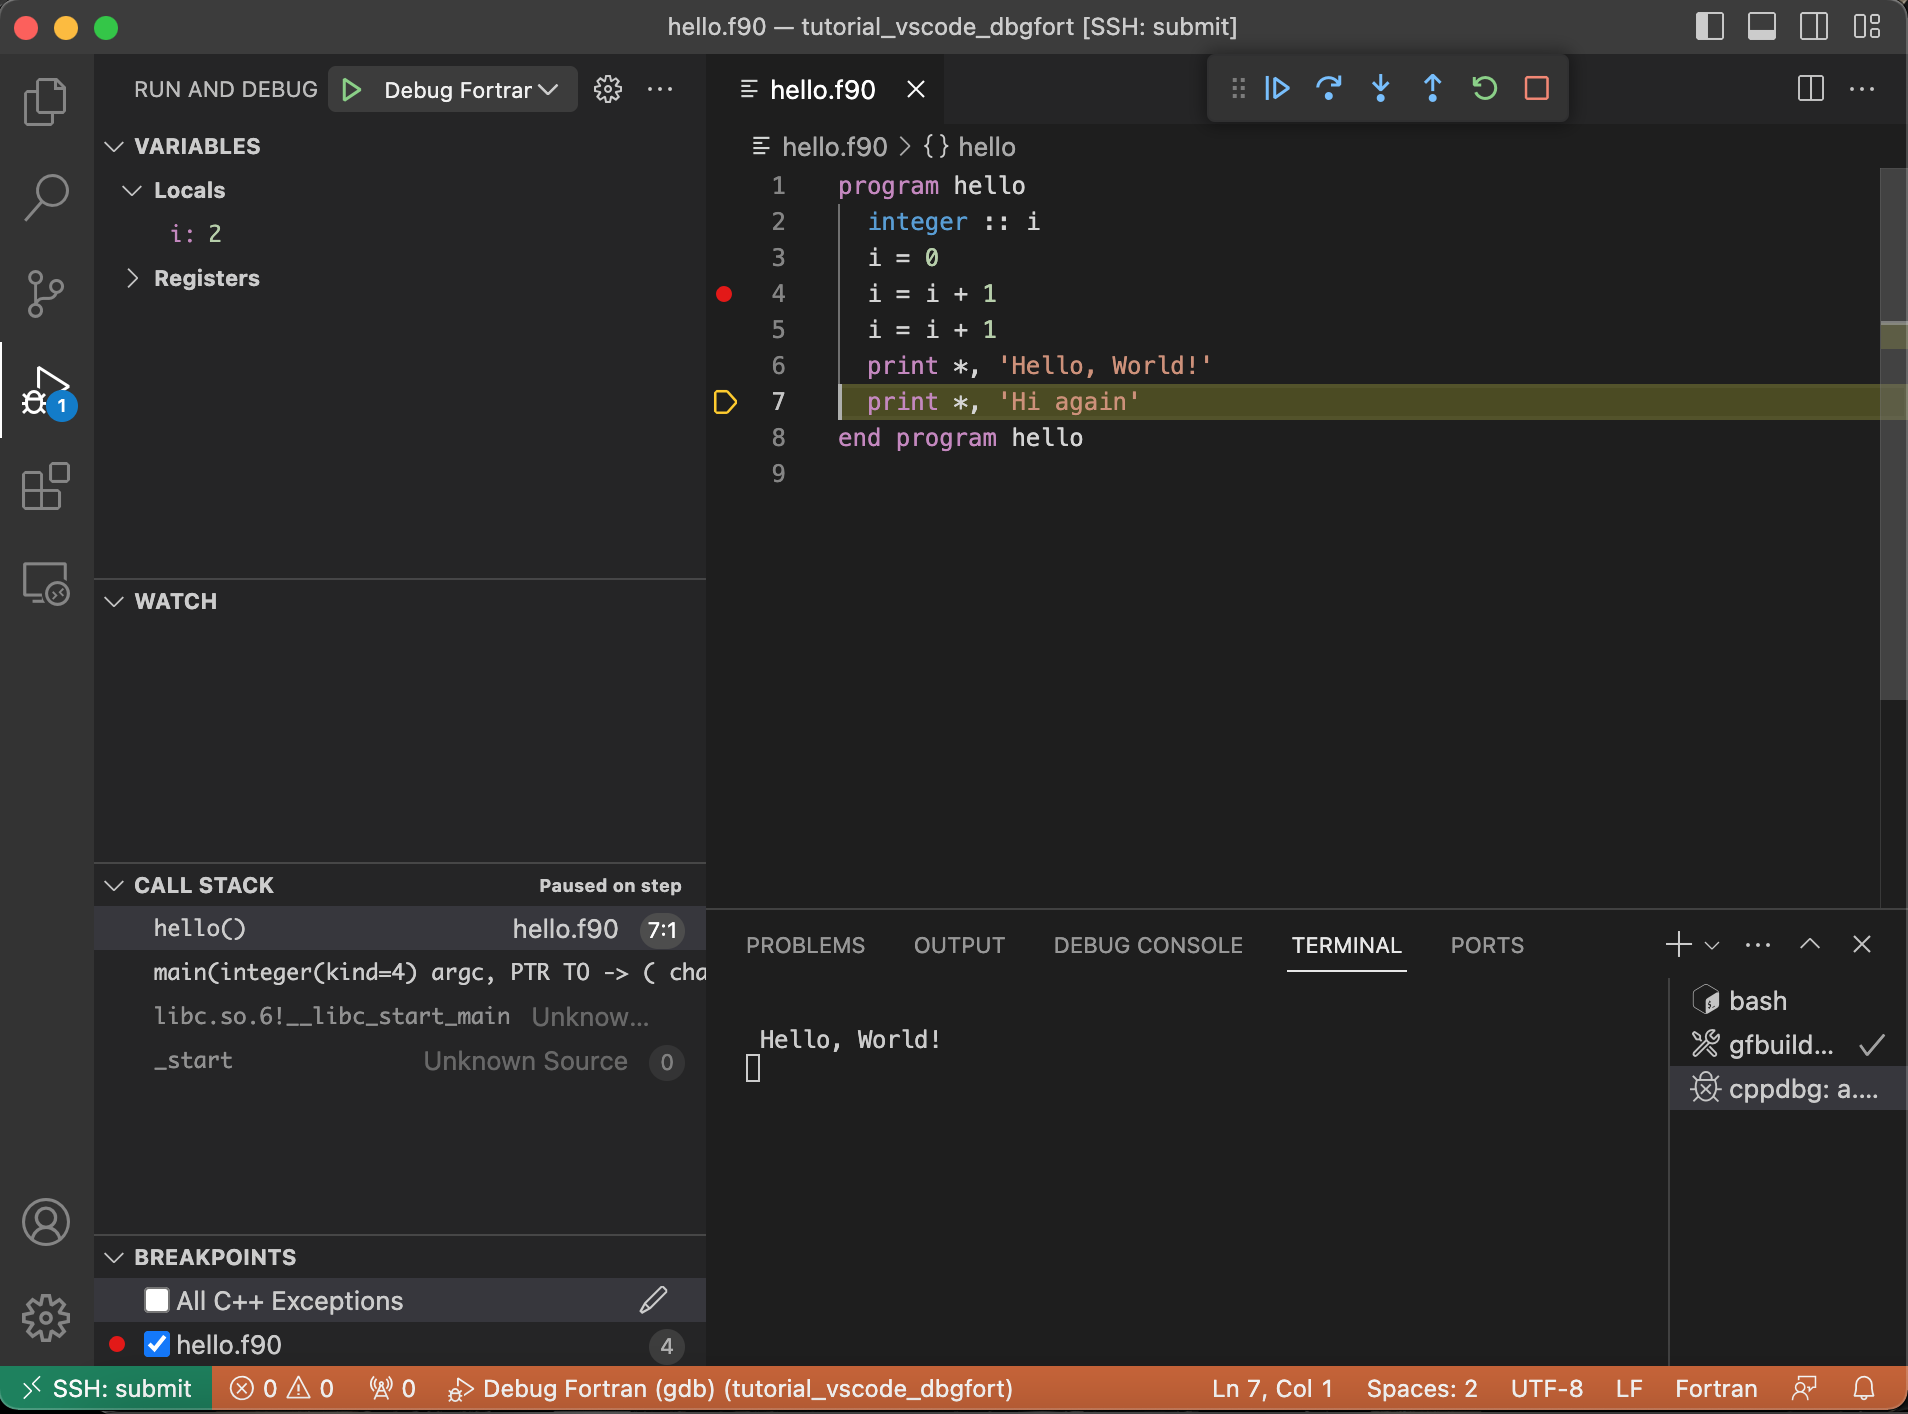
Note that now the yellow arrow and highlighting indicate that the execution is now halted on line 7.
Also note that, now that line 6 has been executed, we see “Hello, World!” appear in the Terminal screen at the bottom of the window.
(Note: “Hi again” does not yet appear because line 7 has not yet been executed).
The variable
istill has the value of2, since line 6 made no modification toi.Click the “Step Over” button again to advance execution by one line.
You will then see the yellow arrow and highlighting indicate that the execution is now halted on line 8.
Also, now that line 7 has been executed, you will see “Hi again” appear in the Terminal screen at the bottom of the window.